
Methodology and Development
In this article, the methodology used by the site’s simulation page will be explained. This is not exhaustive or complete, just a detailed account of the overarching assumptions made by me during the development of the site, and the journey of creating the site. This article assumes that you have some general idea of the frequently used terms on this site.
Firstly, let’s talk about how we adjust the Party Polling rates on a constituency level. It just simply takes the proportion of difference, that being NewRate/OldRate, and multiplies the votes in each local constituency by that ratio. For example, changing Labour to 45% instead of 30% would mean every constituency would have Labour see an increase of 50% in their votes. As 45/30 = 1.5. This works in reverse too, ratios less than 1 will deduct votes from that party.
I will be frank and admit that this is not a great method, but I felt as though it was out of scope of the project to come up with a more complex and realistic model - I simply wanted the functionality for testing purposes and left it in as I thought it was fun to play around with using Voting Intention polls as a basis.
When I compared it to other comprehensive systems made by people who actually have the expertise to make educated assumptions and not made by a bored student, it seems to be fairly accurate, but really big changes tend to get wildly inaccurate.
Next, is the constituency grouping. Right now as of writing this methodology article, a planned 6th option does not yet exist, so I’ll explain how the current ones work.
The groupings take the categories made by the Government, and simply arrange them together to form larger constituencies. How this impacts the election is based on your MP Mode, which we’ll get to later, but the default simply assumes the number of sub-constituencies is the amount of MPs in the new larger one. This is useful for approximating how STV and Party Lists PR would work, and that’s the primary purpose of the project.
The 6th option would be more complicated but is more accurate and more fun. It would be called Gerrymandered, which lets you customise groupings yourself, with no restrictions on size. This theoretically wouldn’t be hard to implement, so it might be implemented on release, but if it’s not there, that’s because, in true programming fashion, it was 10x more complicated then how I abstracted its design, and I will go through suffering.
(Gerrymandering for those who don’t know, is when constituency boundaries are redrawn to benefit a specific party or to weaken the voting power of a group.)
Next is Voting Type, which is where everything gets a bit complicated. Plurality was fairly easy, single seat constituencies just check for the biggest vote, and anything bigger than that reward it proportionally. The second part was way more annoying to get working than it sounds because I wrote my initial grouping code weirdly so I had to spend several hours refactoring it. Loser Takes All just takes this operation and reverses it, giving as many seats to the biggest losers as possible.
Before we jump into Runoff Voting, let’s just look at voting overall, how does a system without the need to tactically vote impact an election? How many people would change their ballots? Who would they change it to?
These are big assumptions that would drastically alter an election’s outcome, and I really wanted to give an honest outlook on what different electoral systems would look like.
My solution was this: First, sort the constituency votes and to their parties into a list. Then, cut out the top two parties in a local constituency from that list when we are correcting tactical voting. Then, take a proportion of votes from those 2 parties. Now we need to redistribute them evenly between each smaller party.
At first, this redistribution simply gave those votes to each smaller candidate proportionally based on how many votes they received prior. But this behaviour led to some weird results, mostly the most insane Lib-Dem surges you’d ever see. This is because it was ignoring the actual reason behind tactical voting, which was simply to keep the one you least like of the top two from winning. This does not actually mean you agree with the third party. It should be that 1 tactical voter from Labour would be far less likely to vote UKIP then one who was voting Conservative, regardless of it being the third biggest.
So I went back to the “take a proportion” stage. Instead, I gave each party a “political position” value, based on the wikipedia descriptions of their leanings (yes I know sh). So Labour was put as “centre-left” and Conservatives as “centre-right” and Lib-Dems as “centrist”. There were 7 different values you could have, 3 on each leaning, that being Far-Moderate-Centre and then the middle point which was declared to be Centrist
Far was not used very often, and for the purposes of the simulation, all “Independant” candidates were marked as Centrists.
Now, using the distance between the initial party and the other parties to be given votes, we can assign each party a weighting. The largest weighting if its a candidate from the same party, a large weighting if its the same position (0 distance), a moderate weighting if its not far off (1 distance), and a small weighting if its really far off (2 distance). Anything beyond that received a very miniscule weighting. The votes are then reallocated based off these weighting
Now back to Runoff voting. This system wasn’t only just designed for tactical voting, but for Ranked Choice too. With our political distance model, we can easily tell what party should come next from the one we are on.
So how does Runoff work then? Let’s look at a single member example first. Firstly, we correct for tactical voting in the default Tactical Voting mode, as the Spoiler Effect is eliminated, and thus tactical voting would not occur. Then, we take a look at that list we made before, check if there’s a clear winner, and if not, ask who is the biggest loser. The biggest loser has 100% of their votes taken and are removed from the list, and using our Political Distance system, we reallocate the votes based on those weightings. We never actually think of individual voters in this model, rather we simply predict what proportion of the voters would maybe put one candidate as their next choice, then reallocate votes based on that prediction. In an actual election, the specifics of the vote would be alot more messy and nuanced, and this is merely an abstract from that so we can simulate the behaviour in an “almost right” way. This process as described repeats until a majority is reached by a candidate.
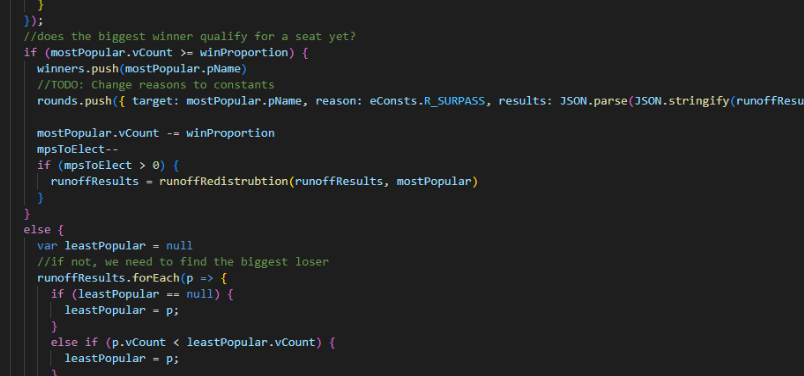
If we have multiple MPs in a Runoff constituency, then Winners have something interesting happen. Like in the Single Transferrable Vote, in order to not waste anyones vote, we take the excess from what was needed to win, which is the percentage 1/(number of MPs). So for four MPs, you’d need 25% to win. So for this excess, say we have 28% of the vote on one person, and you need 25% to win. Well, we would take that excess 3%, and then apply our political distance redistrubution method after we removed the original candidate from the list (as they had won).
I feel like these are some big assumptions, but ultimately, are compelling and simulate the system fairly well. When I compared this system to a model made by experts, (i forgot which one and couldn’t find it i am SORRY), it was fairly close, and I had spent an all-nighter on it so yeah, good enough as we say.
Next we come to the options, Tactical Voting Mode, and MP Mode. We’ll explain Tactical Voting Mode first. Tactical Voting starts off in “conditional” mode, where other parameters in the election determine if we need to correct the assigned proportion of tactical voters from the electorate. “Off” will never correct, and “Always” will always correct for the proportion, even when tactical voting is part of the system (such as First Past the Post). This was how I achieved the results found in the Spoiler Wall article!
MP Mode determines how we assign a number of MPs to a grouping of constituencies. “Off” is the default, and this just means that the size of the group assigns the number of MPs a constituency has. Alter instead sets a groupings MP count to the chosen value, regardless of size. Limit is much more interesting, it came from a need to test STV with an average of 5 MPs per grouping. It does this by breaking up the groupings, to make each sub-group not contain anymore constituencies than the selected value. As a limitation of the design, geographic proximity could not be respected. This is because I hated working with GeoJSON (the format that the British map is stored in) (this is also why Northern Ireland was left behind. Sorry mates, I spent 3 days just to get the page to turn black, and THAT WAS PROGRESS WITH THIS STUFF). And also because when I looked it up, a solution someone found had to do with an “adjacency matrix” and as you may imagine from that discovery, I immediately closed the page.
The charts besides the map were also very “fun” to do but there’s not much to talk about with them. As time of writing, I want to make a third chart to show average discrepancies in percentage between national vote and seats in parliament. But it ruins the composition of the screen so thats a problem for future me.
Then the charts for when you click a Constituency! The “electoral breakdown”! If you remove electoral, it certainly was one of those! Getting the red line to show up on the chart for Runoff votes took two days. There are still bugs because the NPM plugin I’m using was not prepared for the level of graph updates you can do with it, but luckily they’re minor and “good enough”.
The red line though...
I need to share this because it was awful. Ok so the framework I’m using is “React” you literally need to know nothing about it, it just does what it says in the name, it reacts to changes in data. It’s really nice. So the way I do charts is by using a React plugin (good so far! Still annoying though!), but then for the red line, I couldn’t do it with just React Charts.js. I needed to get Chart.js Annotations. I’m new to Javascript, but this Annotations existed outside of that React NPM installation I originally did, so I had to figure out how to get it to display.
Luckily, it was pretty easy to display! I just put in a default of “1”, so it always annotates a red line at 100% vote proportion when it doesn’t know what to do (likely because there’s no Runoff vote)
But then, when I changed around the voting type to Runoff, it didn’t change. I thought maybe its some quirk to do with there only being 1 MP, so I increased that. No change.
Turns out, since this wasn’t made for React, it doesn’t react to changes! Great! But I had seen this bug kinda before, and the solution before was just to feed in a method that gets called every reaction by React. So I did that, and it stayed at 1f. Then I got suspicious that it was caching, and restarted the entire site, and set all parameters so it would first call this method with what should be moving the red line.
NOTHING
I DON’T EVEN KNOW WHY THIS HAPPENED IT DOESN’T EVEN MAKE SENSE WITH THE ACTUAL SOLUTION I FOUND. I THINK MAYBE ITS BECAUSE THE PROPS (data you pass down from parents, its how the form, map, and breakdown all communicate.) JUST AREN’T INITIALISED SO IT JUST DEFAULTS TO THE DEFAULT I SET IN THE METHOD???
I have no clue so I went to the Github and just asked. The greatest shame of any developer, is to admit you actually aren’t super smart, and ask for help, even though doing so hurts no one, except for your pride (because I’m totally this super cool 1000x programmer that just instantly intuits Javascript)
By the way, its just calling the method but putting () => infront of it. I know why this works, I just hate that I was 3 characters away from getting it working and this took me 2 days just to ask for help. Thank you so much to the people Chart.js’ Annotation Github page for answering such a trivial question.
I love programming, if you can’t tell. Very fun. The lesson from the ramblings of this voting obsessed madman, is just ask for help. Preferably on the Github repository where your problems arise because you’re more likely to run into people who know what they’re talking about. And also on anything else in life I guess but I’m too narrow minded to apply this lesson to anything outside of the day I actually asked for help.
The project is open-source, so you can take a look at everything I wrote if you want more granular details on how this project was built and assembled. Feel free to learn from it and take code as you need it! (I’d appreciate a credit if you do, but honestly don’t bother if you can’t fit it into the feel of your project.